Below is my “first” Tableau Public viz. Click the picture to go to Tableau Public to interact:

For many of you, this is an already-known, super-simple tip. But I share this with you in order to talk through my process of discovery and how I have evolved over time in my use of Tableau.
I call this my “first” viz because I actually have a view that I published earlier than this, but it’s currently hidden. I’ll keep it a secret for another post :).
At the time I published this, I had been using Tableau for about a month at work. For background: my organization acquired a few creator licenses shortly before I was hired, and no one had more than a couple hours of experience using Tableau. I had used the free student version in grad school for a project for a class, so had some familiarity with its functionality.
At work I was assigned the task of creating some charts for one of our reports. Equipped with my trusty tool, Google, I set to work creating charts. Whenever I ran into problems (hourly…minutely…) I would turn to the Tableau Community Forums for answers.
I was trying to figure out how to make the drop-down filter text size bigger, but wasn’t having any luck. One commentator complained that during presentations, it was difficult for his colleagues to see what the view was filtered on because the text in the filter was so small. I figured, “There has got to be a better way to display this.” With Tableau, there is always a workaround!
The problem: Using a drop-down filter as a title will be too small for the audience to see.
The solution: Create a Title Sheet that displays the text of the filter in larger print, and place it at the top of the dashboard.
The steps:
- Create the views you want to put on your dashboard
- Determine what you want to filter your views on
- Create a new sheet in order to create the title
- Create a dashboard with the title sheet at the top, then the views, then the filter at the bottom (out of the way).
I’ll go through this step by step.
Create the views that you want for your dashboard, and add the dimension you want to filter on to the Filters shelf in these views.
I knew that a filter could work on text, so after a bit of experimenting, I settled on this:
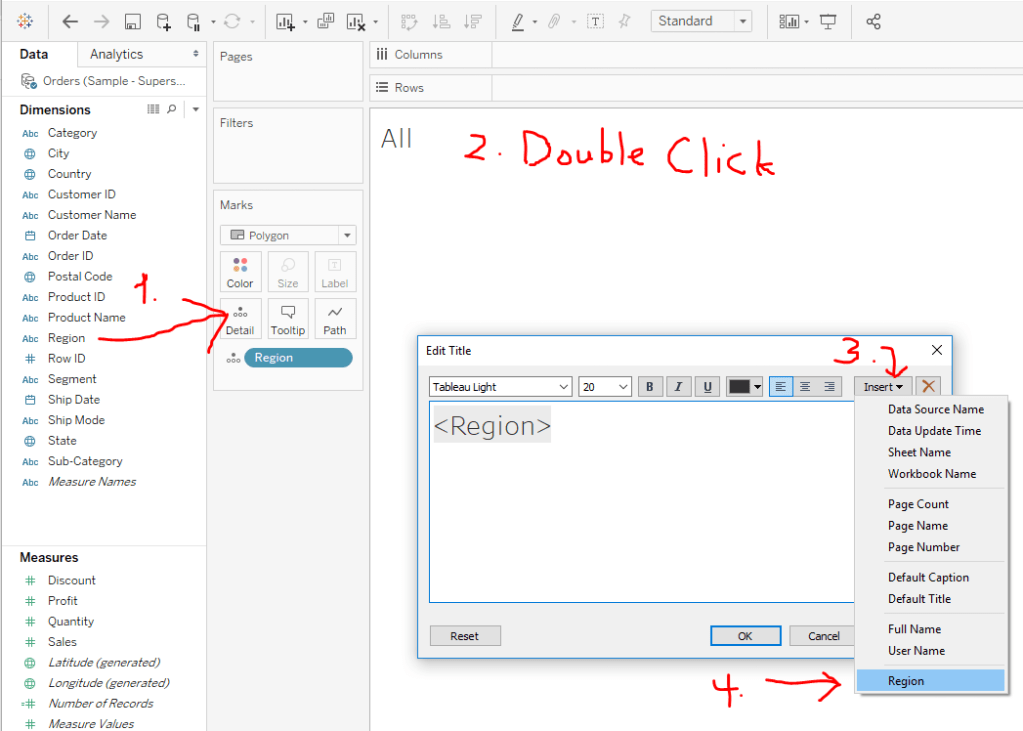
Open a new sheet and name it “Title Sheet.” Drag the same dimension that you used as a filter in the other views to the detail card. Double click the title area of the view. Highlight the text that appears in the “Edit Title” dialogue area. Click on Insert. Select the dimension from the bottom part of the list. Hit OK. Lastly, I like to put the mark type as “Polygon” because the sheet displays blank.
Now, create the dashboard. Place the main views where you would like them positioned. Now drag the “Title Sheet” above the other views. Move the filter view below the other views.
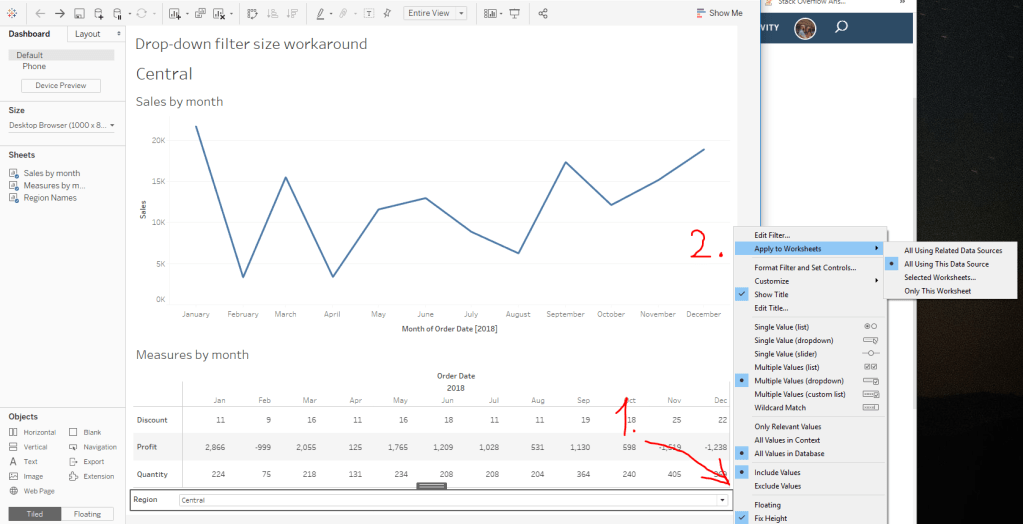
Then, click on the filter view, select the drop-down arrow (note: NOT to change the filter but the grey arrow to change the options) and apply the filter to the “Title Sheet.” This can be done with the “All Using This Data Source” or you can click into the “Selected Worksheets…”
Once you have done that, when you use the filter it now also displays the text in the filter in your “Title Sheet” as well:
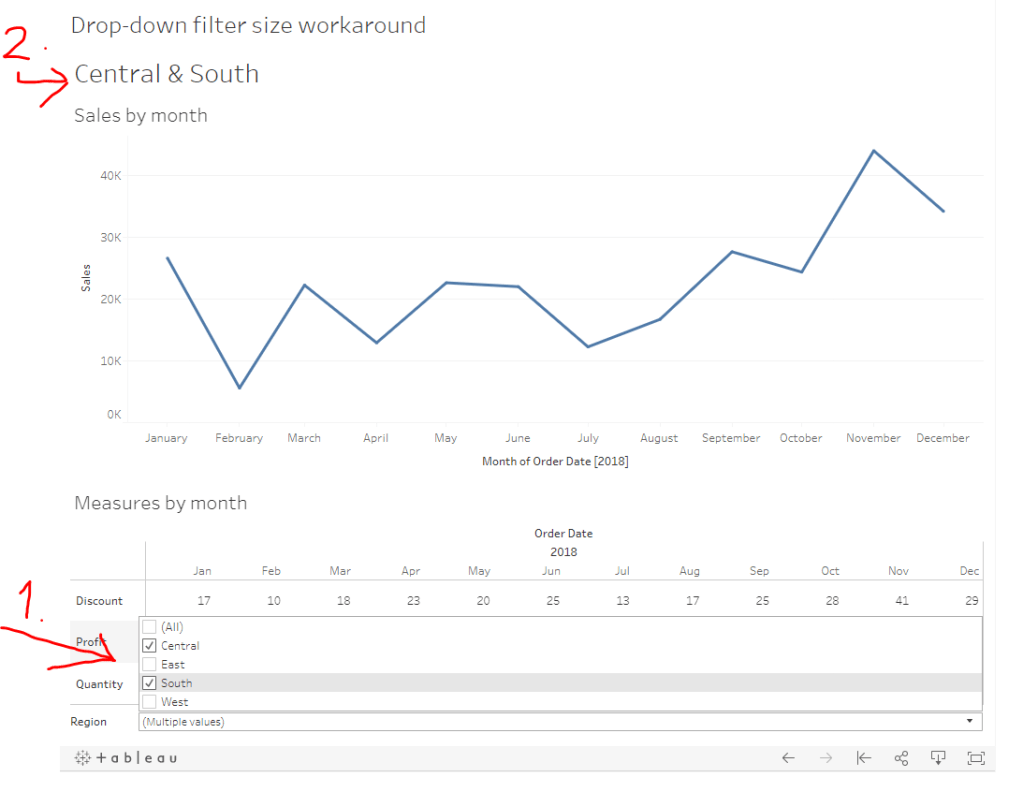
In presentations, this is a great way to make it clear to your audience the current filter applied to your views. And since I was so excited I “discovered” this workaround, I decided to share it with the world on Tableau Public. That’s the story of my “first” viz.
