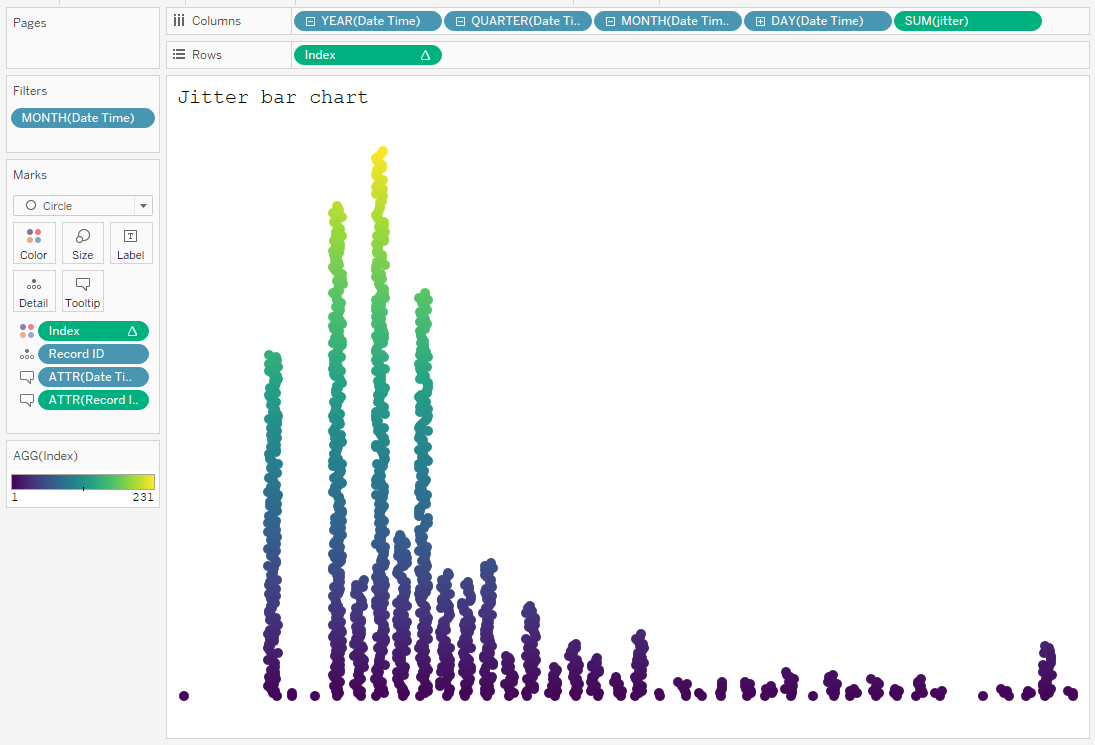
The following are some ideas for creating interesting bar chart effects using jitter plots. Previously, Toan Hoang of Tableau Magic has written about jitter bars using two dimensions of random() for a nice effect. Below I introduce modifications on creating jitter bars using random() and index() along with playing with sizing and color to customizeContinue reading “Jitter bar charts”
Category Archives: Uncategorized
Clear all filter-action selections with a single click
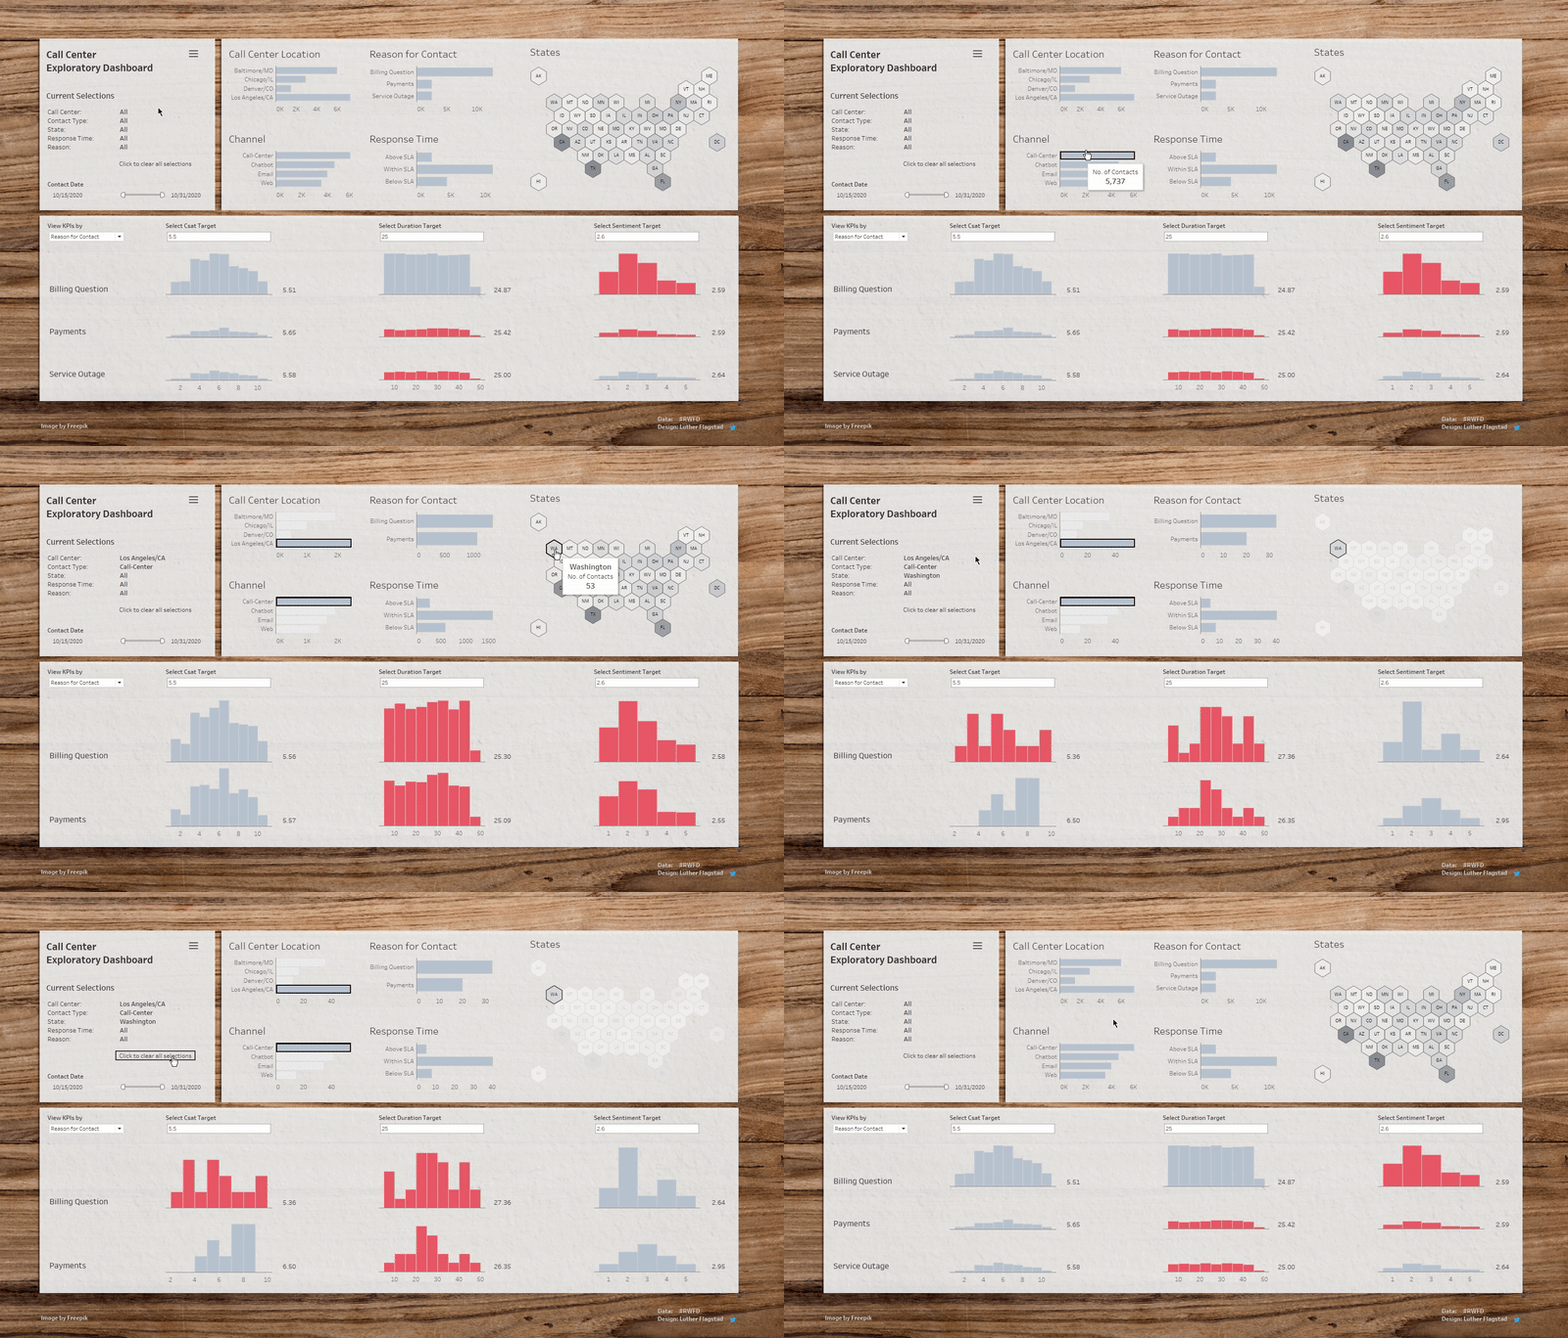
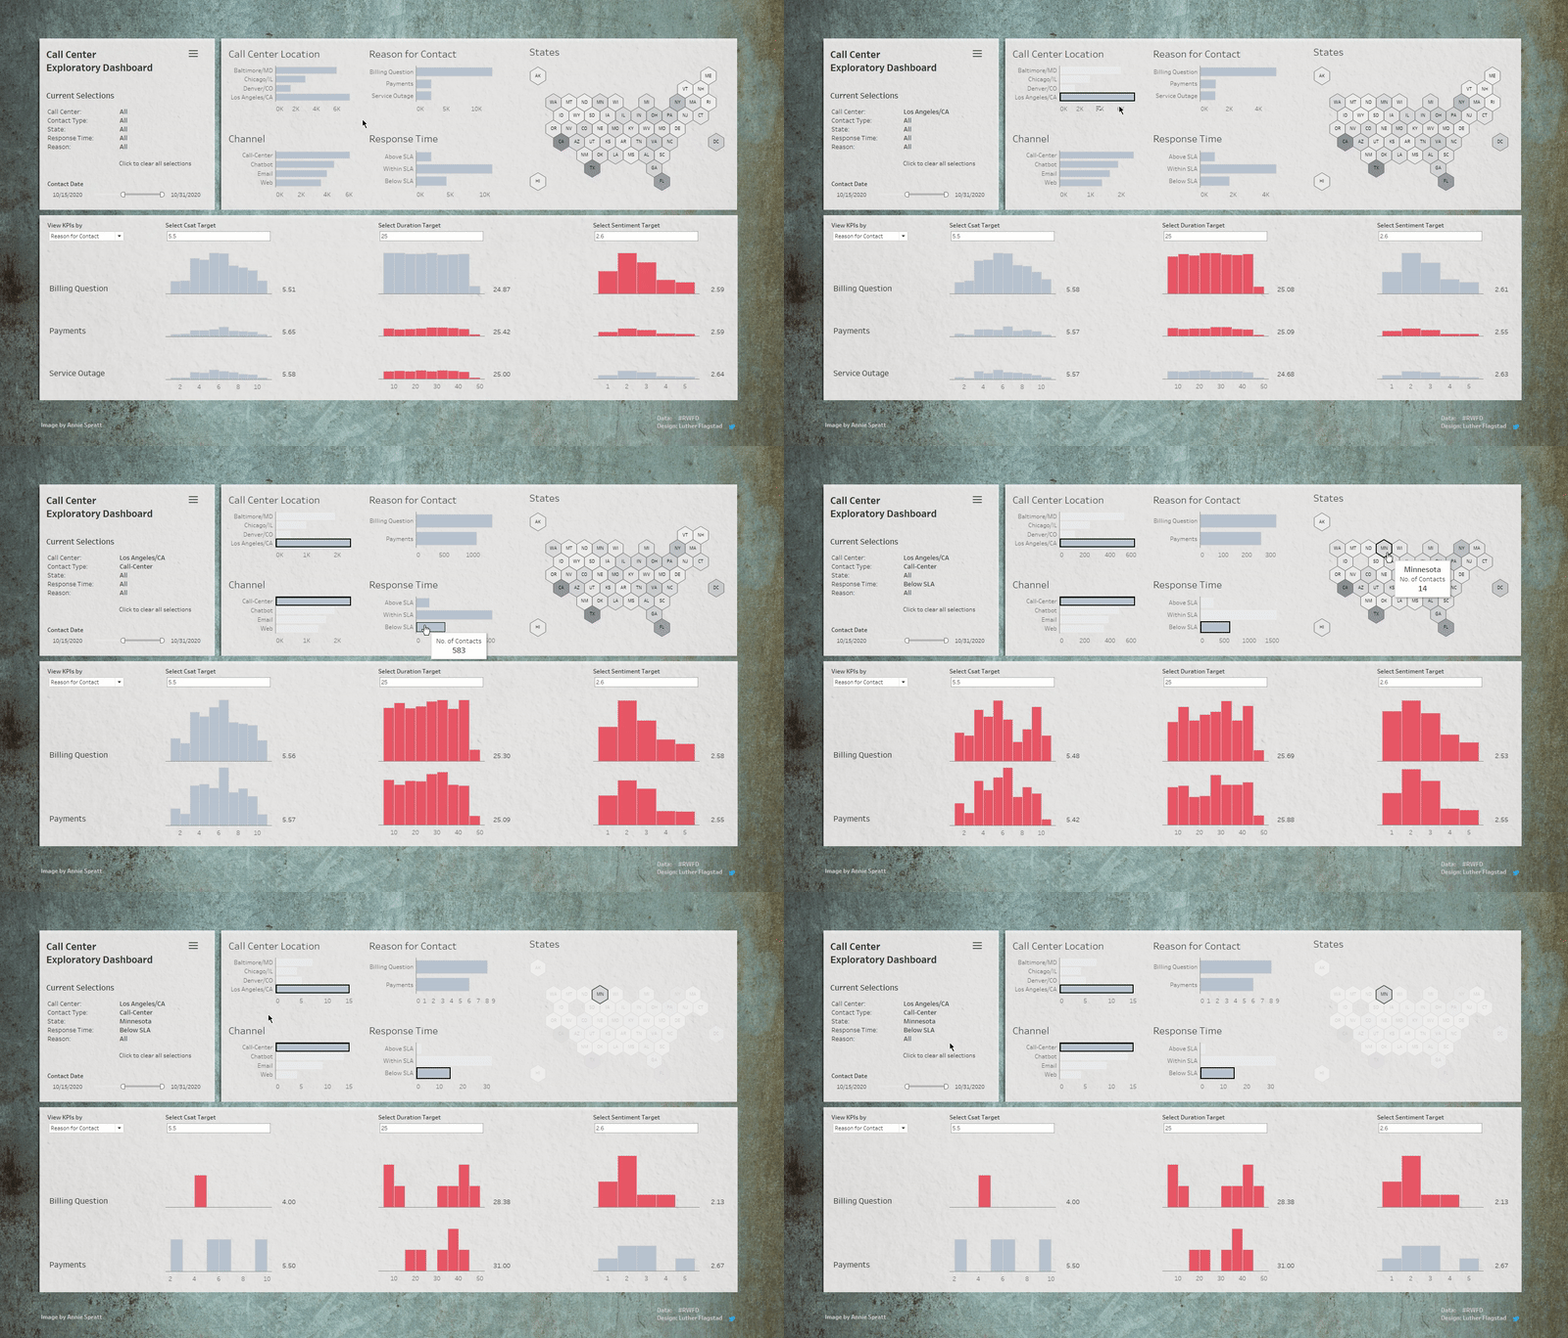
In the previous post I showed how to keep track of filter-action selections by creating a list. This is fine for making the selections. But what about de-selecting? Typically the user would need to go back and find each of the marks they clicked and click on them again to deselect. However, here we canContinue reading “Clear all filter-action selections with a single click”
Keep track of filter actions with a selections list
In Tableau, an alternative to the default filter is to use a dashboard filter action. In this functionality, selecting marks in a source sheet will filter the view in a target sheet. But what if you have multiple source sheets as potential filters? Even with just two or three source sheets it can be difficultContinue reading “Keep track of filter actions with a selections list”
Data Analysis Documentation Tool
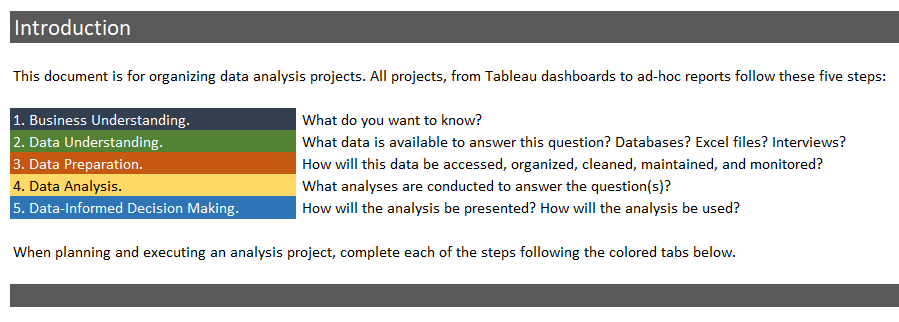
This tool is meant to help you organize and document an analysis project and increase the chances of a project’s success. Taking you through a project life-cycle from asking business questions to presenting insights, the tool covers the major stages of any analysis project from a high-level, repeatable, comprehensive process. I based the tool conceptuallyContinue reading “Data Analysis Documentation Tool”
How to make a Calendar Timeline in Tableau
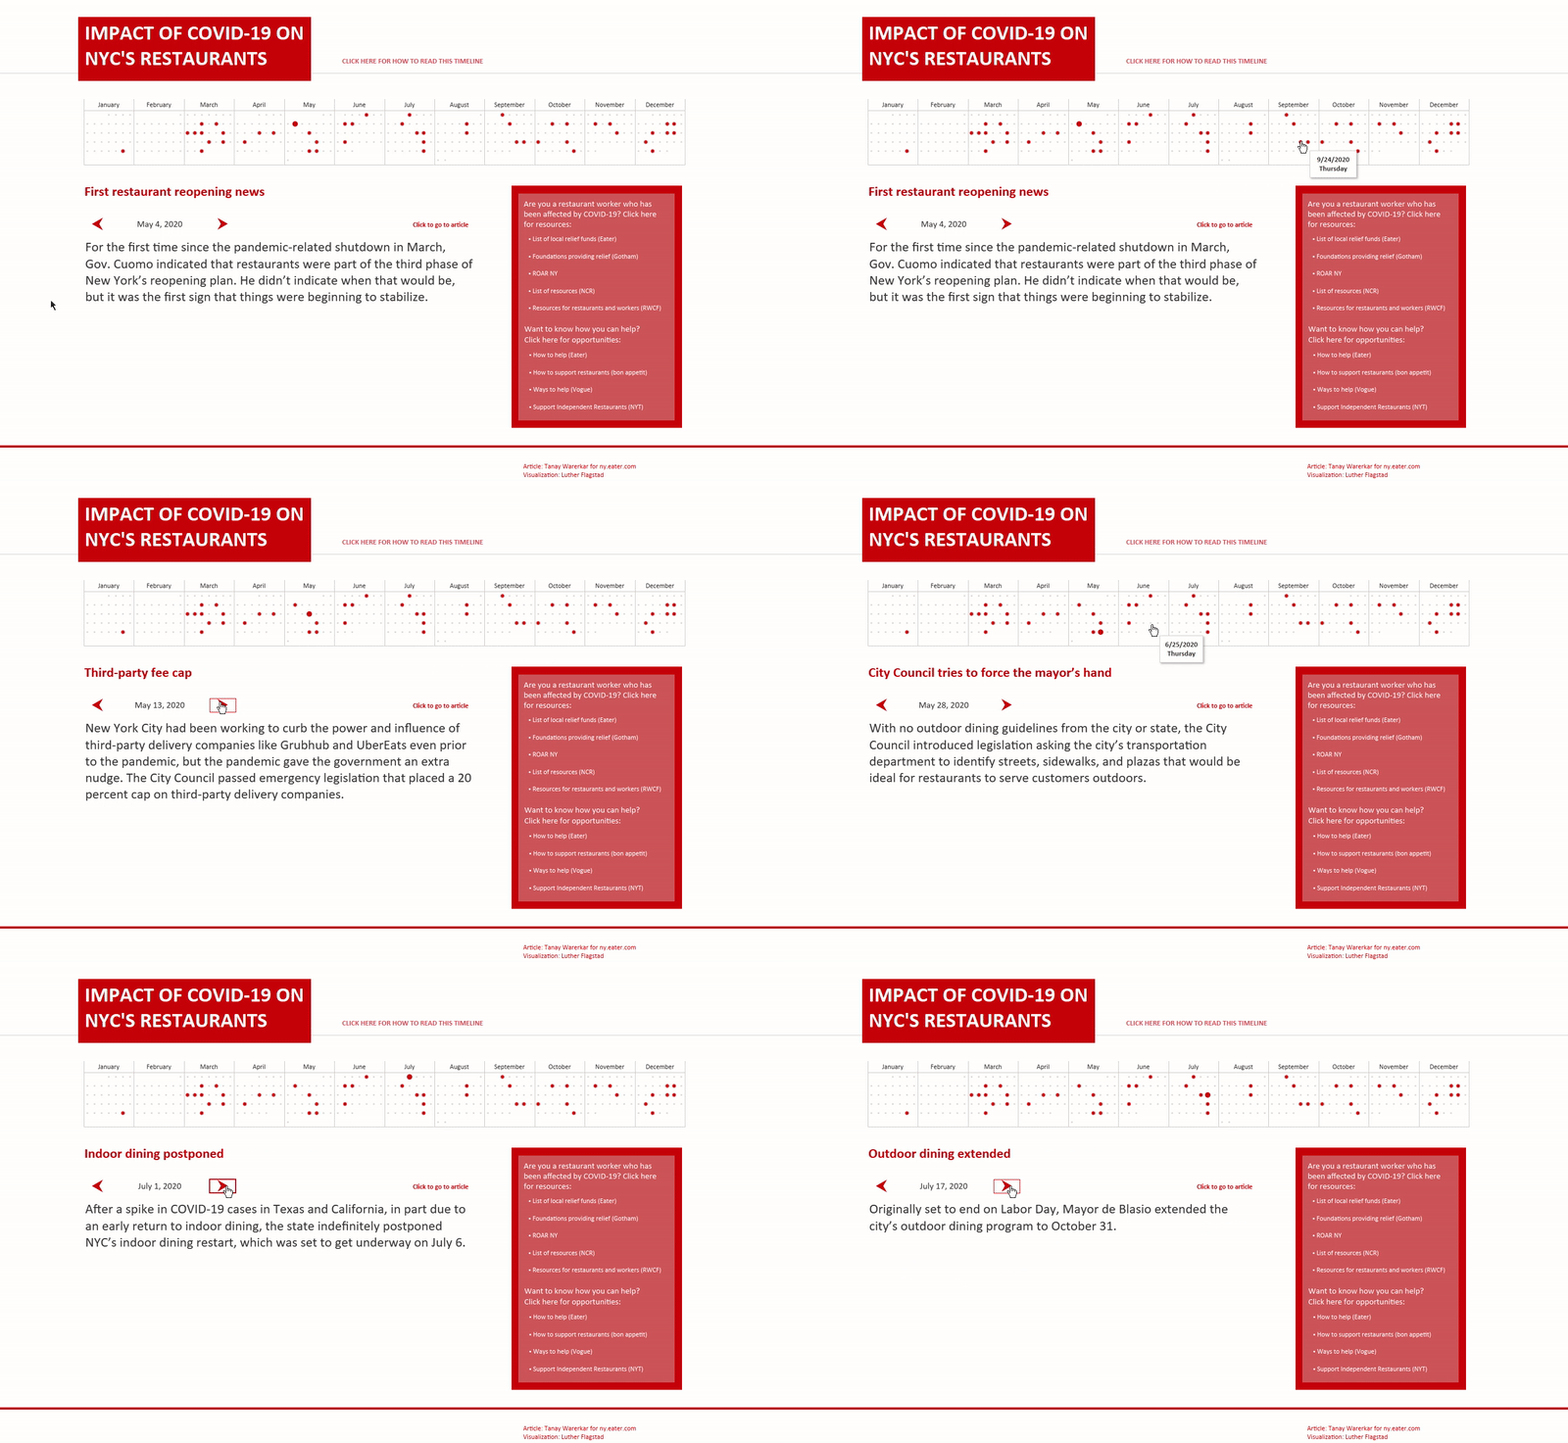
There are many unique ways to make timelines using Tableau. There’s: the classic the curvy the scrolling lollipops gantt charts vertical timelines classic timelines half-circle or bubbly timelines stacked bars and bump charts There’s all kinds of calendars too: as squares gantts single months Planners and other planners Using parameters and more parameters and withContinue reading “How to make a Calendar Timeline in Tableau”
Making a directory with table pagination
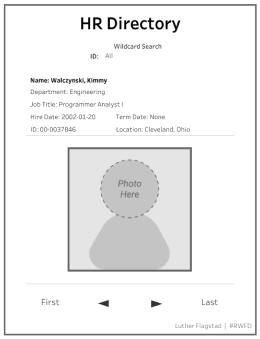
Mark Bradbourne’s Real World Fake Data (#RWFD) initiative inspired me this week to try and make a directory from the Human Resources (HR) data set. I knew I would need some kind of pagination, so I ventured out into the interwebs for a look. Luke Stanke’s imaginative post popped up and I set to workContinue reading “Making a directory with table pagination”
Holiday lights display guide map
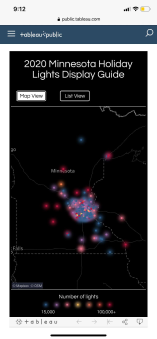
A couple weeks ago when looking for data on holiday light displays, I came across a website that showed a list of different houses and locations in Minnesota that were displaying lights this holiday season. The website had a little map made with batchgeo, showing the locations of displays as well as a table view:Continue reading “Holiday lights display guide map”
Behind the viz: Sketching pay inequality
This was an idea I had for the #MakeoverMonday week 37 topic, but didn’t have the tools to make. Having recently got an apple pencil, I decided to revisit this week’s topic and see if I could put the idea to, well, e-paper. The data set comes from the School Workforce Census conducted by theContinue reading “Behind the viz: Sketching pay inequality”
Dynamic Fields in a Tooltip
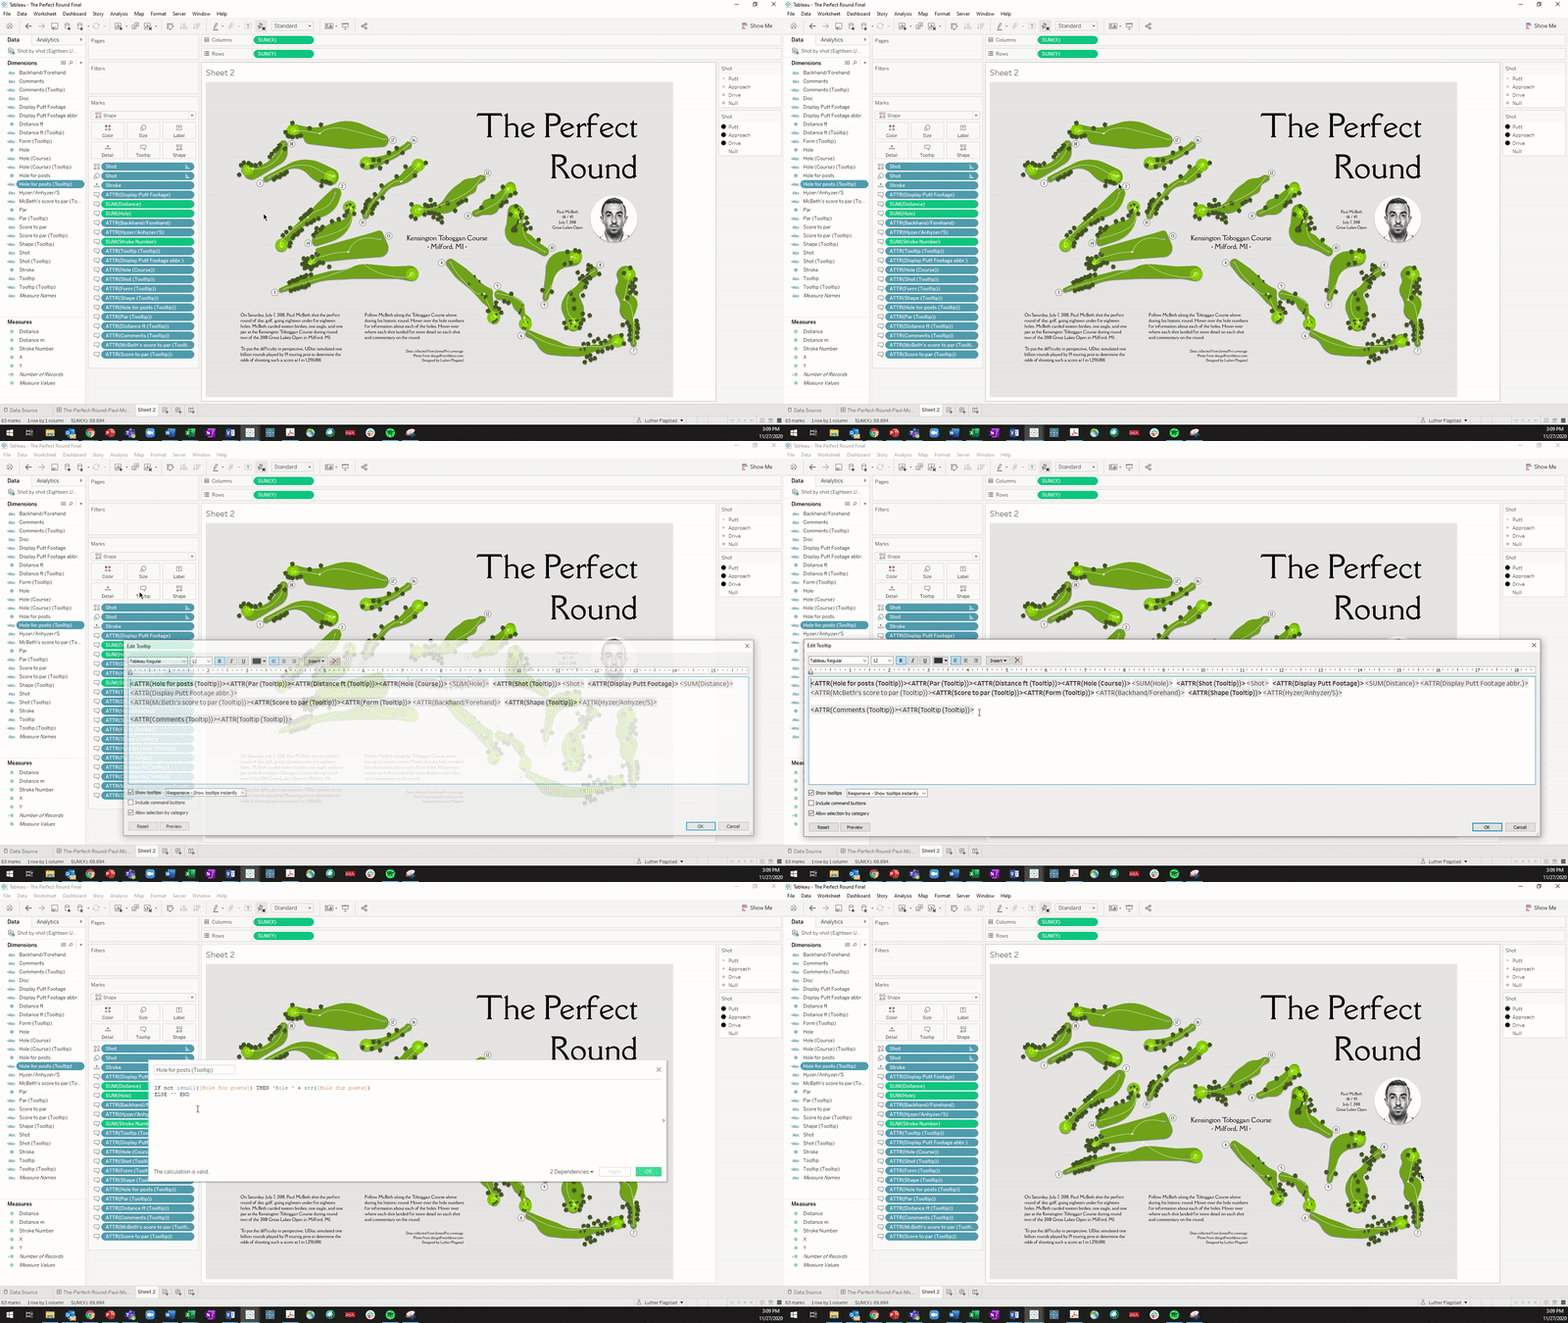
When you have measures or dimensions that are only applicable to some of the marks in your view, you can use a simple calculation to–in effect–make multiple different tooltips with each being relevant to their respective marks. Let’s dig in to an example. In my example, I have a scatterplot with each mark having anContinue reading “Dynamic Fields in a Tooltip”
Refer to different sheets in a tooltip
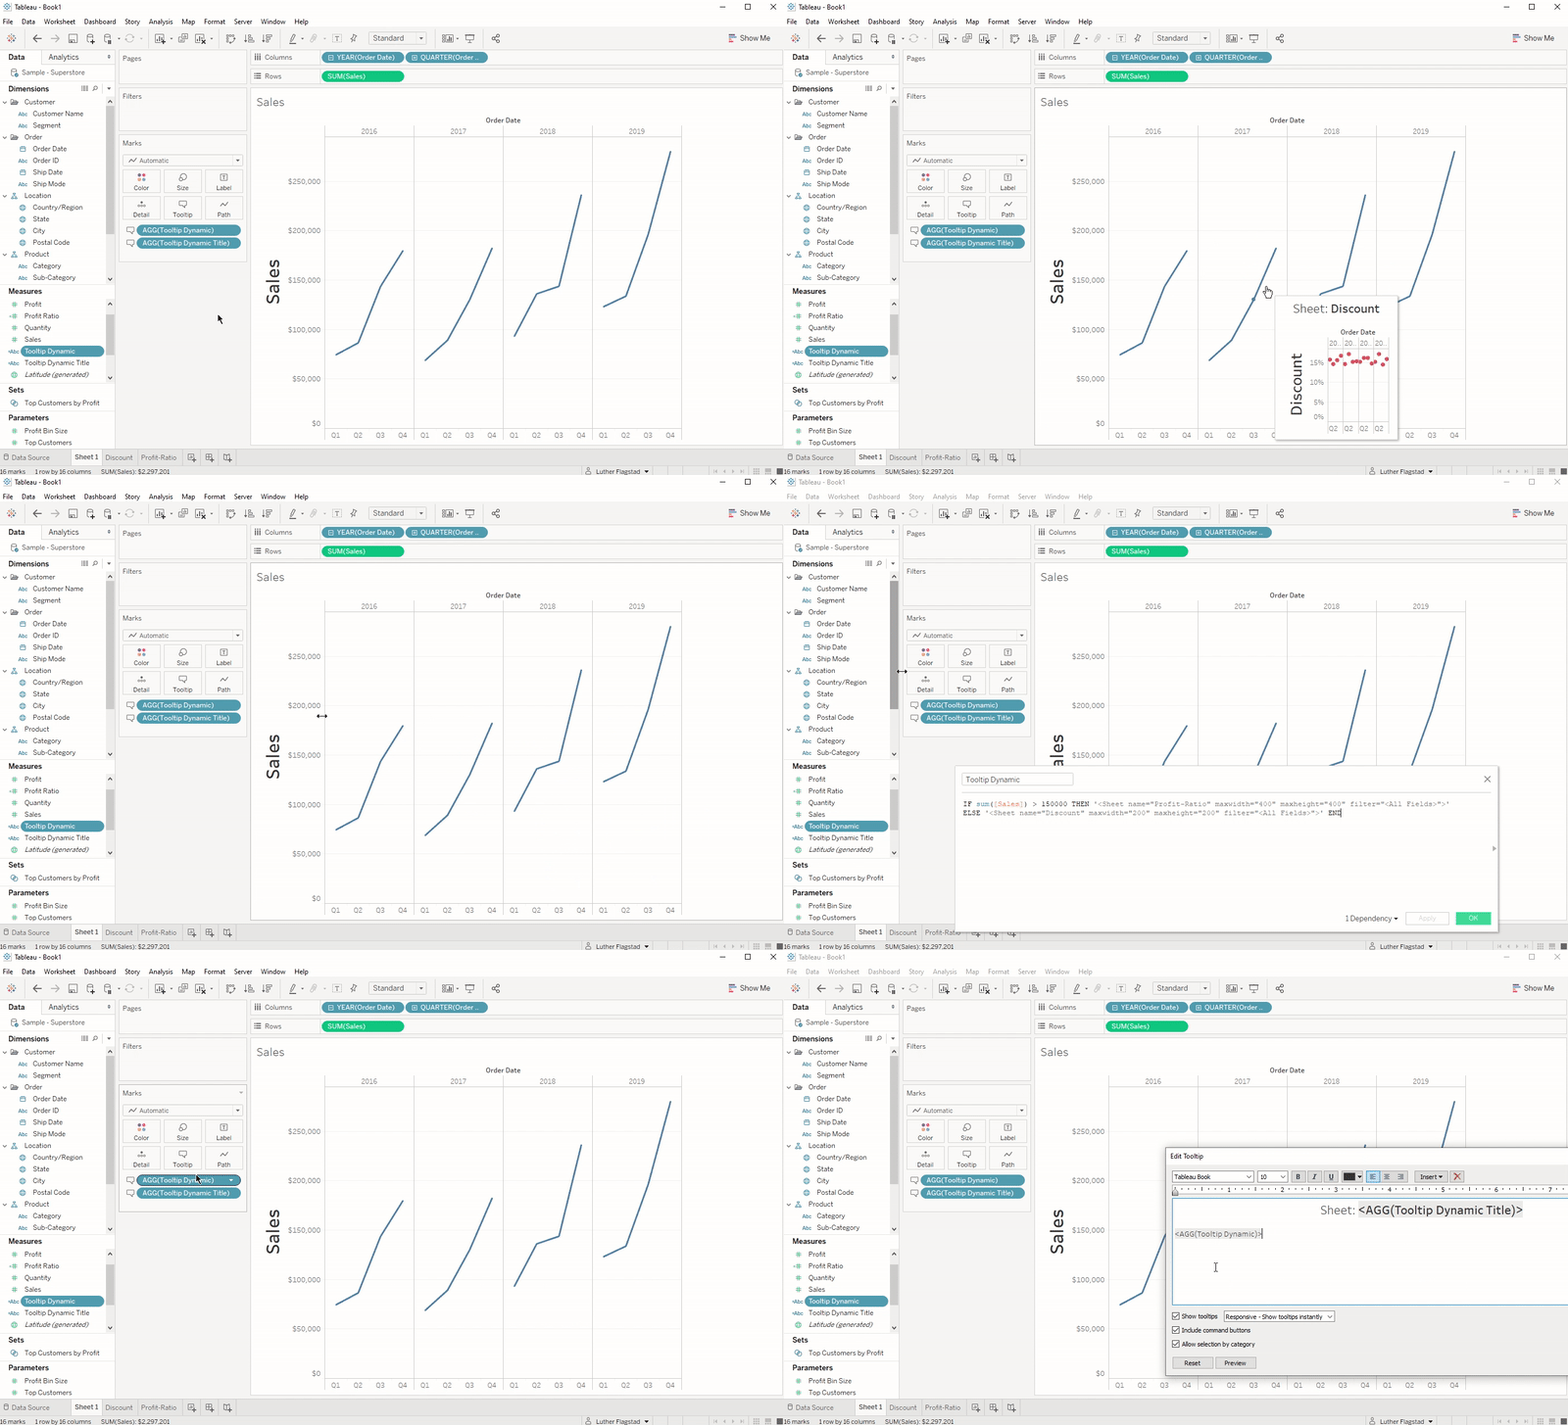
[Edit: The following sadly only works in Desktop and will not work once published to Server, Online, nor Public. Thanks to Ken Flerlage for pointing this out.] It is possible to show different sheets in a tooltip depending on which mark you hover over. The trick is to use the Tableau code generated from insertingContinue reading “Refer to different sheets in a tooltip”
