In the previous post I showed how to keep track of filter-action selections by creating a list. This is fine for making the selections. But what about de-selecting? Typically the user would need to go back and find each of the marks they clicked and click on them again to deselect. However, here we canContinue reading “Clear all filter-action selections with a single click”
Tag Archives: Tableau Tips
Keep track of filter actions with a selections list

In Tableau, an alternative to the default filter is to use a dashboard filter action. In this functionality, selecting marks in a source sheet will filter the view in a target sheet. But what if you have multiple source sheets as potential filters? Even with just two or three source sheets it can be difficultContinue reading “Keep track of filter actions with a selections list”
Refer to different sheets in a tooltip

[Edit: The following sadly only works in Desktop and will not work once published to Server, Online, nor Public. Thanks to Ken Flerlage for pointing this out.] It is possible to show different sheets in a tooltip depending on which mark you hover over. The trick is to use the Tableau code generated from insertingContinue reading “Refer to different sheets in a tooltip”
Reveal marks with a click to drive the story

You can introduce marks within a single chart one at a time (or in groups) through the use of a parameter action. And, by adding narrative points to your data, you can create an interactive user experience that drives a chart’s story. Here’s an example of what that looks like: Here’s the demonstration:
“Small-Multiples/Callout” Viz

Overview When each little chart within your small multiples chart (aka trellis, aka tile chart) contains too much detail to be fully absorbed from a distance, it can be helpful to incorporate a “Callout” view into your viz. The Issue Most small multiple charts I’ve seen contain the labels right in each little chart. ThisContinue reading ““Small-Multiples/Callout” Viz”
The Baby Bump Chart
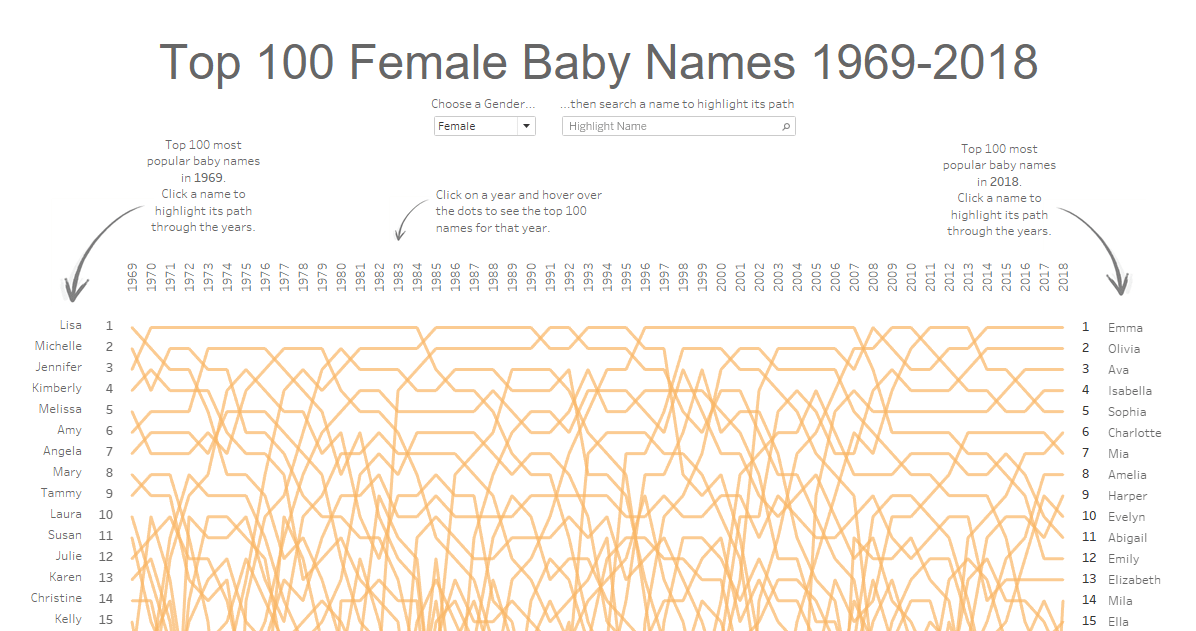
The following post is about the process of creating the viz Top 100 Baby Names 1969-2018. Click to view the interactive viz on Tableau Public! In my first several months of using Tableau, I did so exclusively for work-related projects. Most of it revolved around preparing reports of counts and descriptive statistics, and all entirelyContinue reading “The Baby Bump Chart”
My “first” Tableau Public viz

Below is my “first” Tableau Public viz. Click the picture to go to Tableau Public to interact: For many of you, this is an already-known, super-simple tip. But I share this with you in order to talk through my process of discovery and how I have evolved over time in my use of Tableau. IContinue reading “My “first” Tableau Public viz”
