In Tableau, an alternative to the default filter is to use a dashboard filter action. In this functionality, selecting marks in a source sheet will filter the view in a target sheet. But what if you have multiple source sheets as potential filters? Even with just two or three source sheets it can be difficult to keep track of the current mix of selections that are being used as filters.
This can be made more clear by using a selections list in your dashboard. Rather than looking across the source sheets to see which marks are selected, you can show these selections in a list making it easier for the user to know how the target sheets are being filtered. This also helps to verify which current filters have been applied, aiding in the accuracy of interpretation.

The solution is to create the list in the title of a new sheet:

- Add the fields you want to show to detail
- Change the mark type to polygon
- Double click the title of the sheet to bring up the edit title dialog box
- Insert the fields at the bottom of the drop-down list
- Format as desired
In my example, I added this sheet to my dashboard and then created a second static list with the names of the dimensions and placed it to the left of this dynamic list. This was purely for formatting as it gave a clean edge to the selections list.
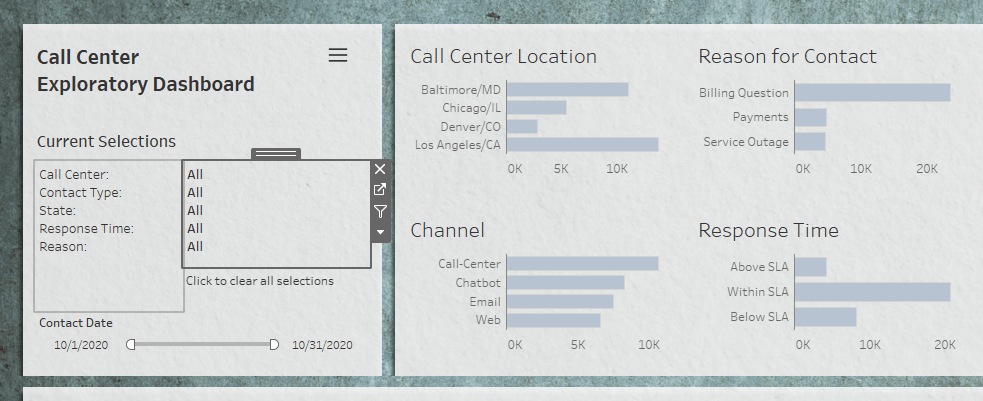
Short and sweet and gives the user an organized summary of the current filter actions being applied.
Check out the next post for how to de-select all of the filter actions with a single click.
