Overview You can give the user the power to turn labels on and off by making use of a sheet-swapping parameter. The sheet-swapping parameter technique has been around since at least 2015 and has since been improved upon with the show/hide icon functionality (Ryan Sleeper) and parameter actions (Keith Dykstra). The following simply uses theContinue reading “Turn Labels On and Off”
Author Archives: Luther
Filter alternative

Overview Instead of using Tableau’s standard filter to filter a dimension in a view, you can create a filter from a separate worksheet that displays the members of the dimension as a list. In certain use cases I find this option to be far more powerful than using the standard filter. Specifically, this filter alternative:Continue reading “Filter alternative”
Making a ‘Thankful’ Viz

Visit the viz on Tableau Public. Recently I’ve been trying to purposefully think more about the things I am thankful for and adopting a posture of gratitude. There are a lot of little ways to remind yourself to be thankful. Some people journal them when they wake up. Some post little notes on the mirrorContinue reading “Making a ‘Thankful’ Viz”
“Small-Multiples/Callout” Viz

Overview When each little chart within your small multiples chart (aka trellis, aka tile chart) contains too much detail to be fully absorbed from a distance, it can be helpful to incorporate a “Callout” view into your viz. The Issue Most small multiple charts I’ve seen contain the labels right in each little chart. ThisContinue reading ““Small-Multiples/Callout” Viz”
Dynamic Borders

During a recent #MakeoverMonday challenge, I thought about the idea of using a view of the data in the title somehow, purely as a design element. There are many ways this could be done, and any number of chart types could work, depending on how you want it to look. I got the idea becauseContinue reading “Dynamic Borders”
The Baby Bump Chart
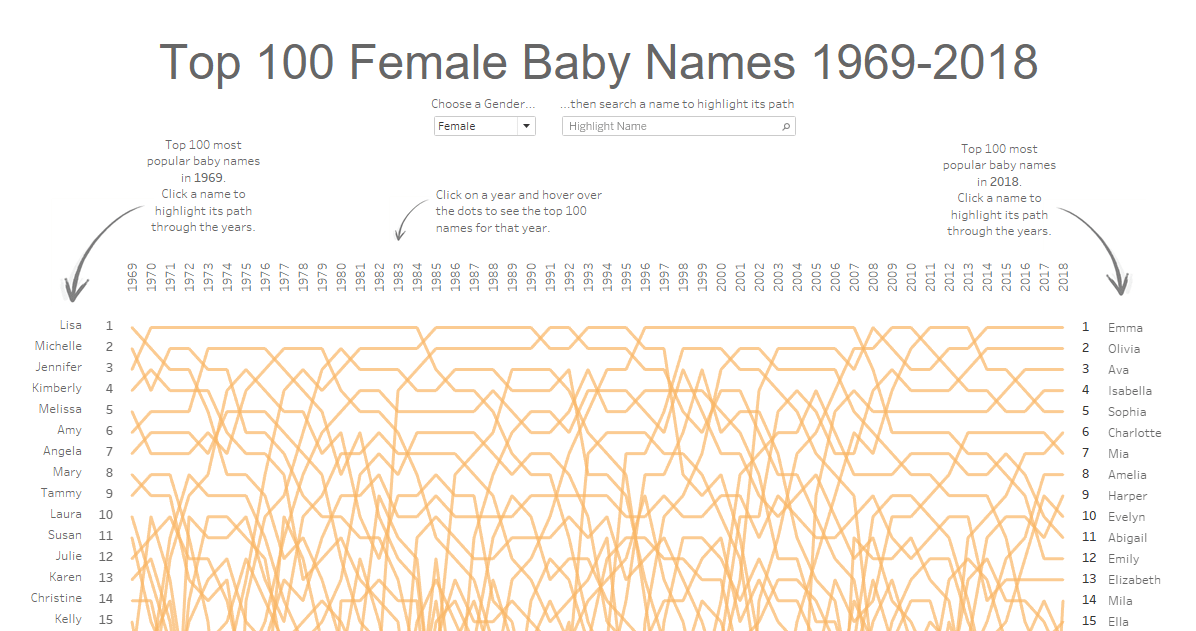
The following post is about the process of creating the viz Top 100 Baby Names 1969-2018. Click to view the interactive viz on Tableau Public! In my first several months of using Tableau, I did so exclusively for work-related projects. Most of it revolved around preparing reports of counts and descriptive statistics, and all entirelyContinue reading “The Baby Bump Chart”
My “first” Tableau Public viz

Below is my “first” Tableau Public viz. Click the picture to go to Tableau Public to interact: For many of you, this is an already-known, super-simple tip. But I share this with you in order to talk through my process of discovery and how I have evolved over time in my use of Tableau. IContinue reading “My “first” Tableau Public viz”
The Icon

As I was brainstorming with my wife for a name for this blog, she suggested I also come up with an icon that would represent what this blog is about. On the theme of “views,” the idea of a sun rising above the horizon jumped to mind. I quickly made this sketch: I feel likeContinue reading “The Icon”
Why another dataviz blog?
I asked myself the same question. I’m new to data visualization, a little over a year in. I have spent that year as a consumer, greedily sucking down whatever resources I could come across on the web. And there are a lot of fantastic resources out there (I’ll dedicate a post to the blogs IContinue reading “Why another dataviz blog?”
