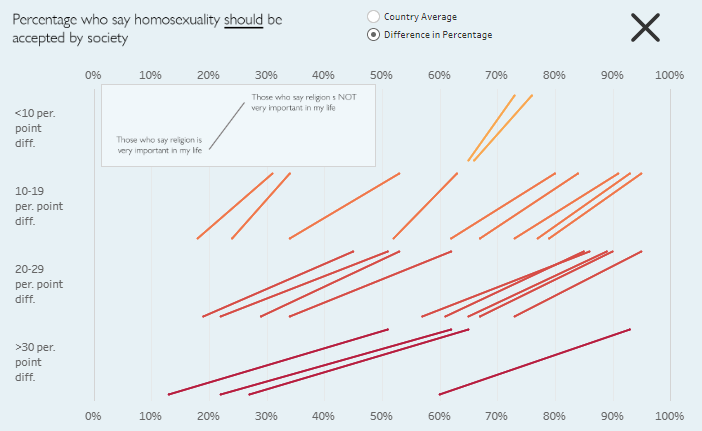
This week’s #MakeoverMonday viz was for #GivingTuesday and in support of Operation Fistula and the work they do to support surgeons providing surgeries for women. I decided to highlight the incredible impact that a successful surgery can have for a woman who is now able to get back to the life she wants to liveContinue reading “Behind the viz: Operation Fistula and #GivingTuesday”
Author Archives: Luther
Figma Fonts: Collection B
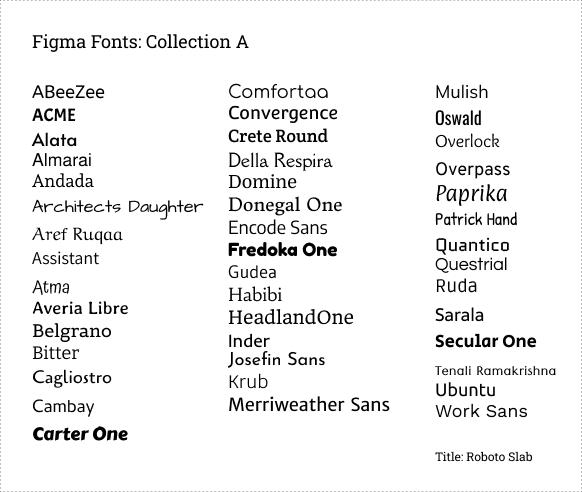
For anyone who also has spent a ridiculous amount of time searching for fun fonts in Figma and wants to cut the line next time, here’s a curated list of silly fonts: You can see a list of more “normal” fonts here, in Collection A.
Figma Fonts: Collection A
The design tool Figma comes with several hundred fonts to choose from. However, there currently isn’t a way to preview the font in the drop-down list. Over time I’ve looked through the list, and I’ve picked out a number that I like. If you see something here you like, just type in its name inContinue reading “Figma Fonts: Collection A”
Add polygons to a scatterplot for visibility
Scatterplots are great, but what if you have a lot of marks clustered together? It can sometimes be difficult to pick out the x- and y-axis values, as well as make your marks stand out. Enter polygons. As an add on to a scatterplot, four-sided polygons can make the axes’ values and the marks moreContinue reading “Add polygons to a scatterplot for visibility”
Reveal marks with a click to drive the story
You can introduce marks within a single chart one at a time (or in groups) through the use of a parameter action. And, by adding narrative points to your data, you can create an interactive user experience that drives a chart’s story. Here’s an example of what that looks like: Here’s the demonstration:
Scrollytelling with Tableau
“Scrollytelling” is a type of visual storytelling. In contrast to a dashboard or viz’s static screen, a scrolly-told story develops as the reader–you guessed it–scrolls down their screen. Scrollytelling has grown quite popular in the last few years, especially in online journalism. In fact, the Washington Post’s most read article of all time is aContinue reading “Scrollytelling with Tableau”
Make a button with a set and set action
It’s possible to swap buttons with a set and a set action by: Choosing a dimension with two members or filtering down to two members Creating a set with one of those members in the set Changing the mark type to shape Placing the set on columns Placing the dimension that is in the setContinue reading “Make a button with a set and set action”
Rounded-tip bar charts
A disclaimer: this is a very “low-tech” solution, and does not contain any fancy calculations. If someone else wants to take up the challenge of making true rounded-tip bar charts, let me know! It is necessary to state up front these are NOT “rounded bar charts.” These are “rounded-TIP bar charts.” There is a significantContinue reading “Rounded-tip bar charts”
What is Seasonal Adjustment? Part 1
In this week’s #MakeoverMonday challenge, we were presented with a data set from the UK’s Office for National Statistics (ONS). In both the Makeover Monday’s and ONS’s data set pages, there is very little description other than the data set’s title, “UK visits abroad: All visits Thousands-SA.” It is extremely important to note that theContinue reading “What is Seasonal Adjustment? Part 1”
Custom Dimensional Slope Chart
In this post, I’ll be presenting the slope chart (or slope graph), showing some examples of how it can be presented, and proposing a unique way of splitting the chart across dimensions of your own choosing. What is a slope chart and when should I use one? A slope chart is a good option whenContinue reading “Custom Dimensional Slope Chart”


